From plastic straws and bottles to food containers and bags, there are the obvious signs of plastic pollution along our coastlines. But once they break down into tiny fragments—known as microplastics—they’re nearly invisible, yet still pose risks to marine life, ecosystems, and even human health.
Microplastics, typically smaller than 5 millimeters—less than the size of a pencil eraser—have been found in drinking water, seafood, and air. Until recently, scientists didn’t have a clear picture of how these pollutants move through estuaries like Narragansett Bay, New England’s largest. Spanning 147 square miles, it’s bigger than Providence, Warwick, Cranston, and East Greenwich combined.
A new study led by Dr. Sarah Davis as part of her Ph.D. dissertation at the University of Rhode Island, under the mentorship of Associate Professor Dr. Coleen Suckling and Professor Dr. Andrew Davies, is helping fill these critical gaps. Funded by Rhode Island Sea Grant, it’s the first published study to directly sample and map how microplastics are distributed across the surface waters of Narragansett Bay. The findings reveal that concentrations are highest near urban centers in the north, largely driven by river runoff, weather, and wind patterns.
“This is a field study aimed at understanding the movement of microplastics on both short-term (tidal) and longer-term (seasonal) timescales in the bay’s surface waters. We combined these observations with modeling to better pinpoint the drivers of these trends,” says Davis.
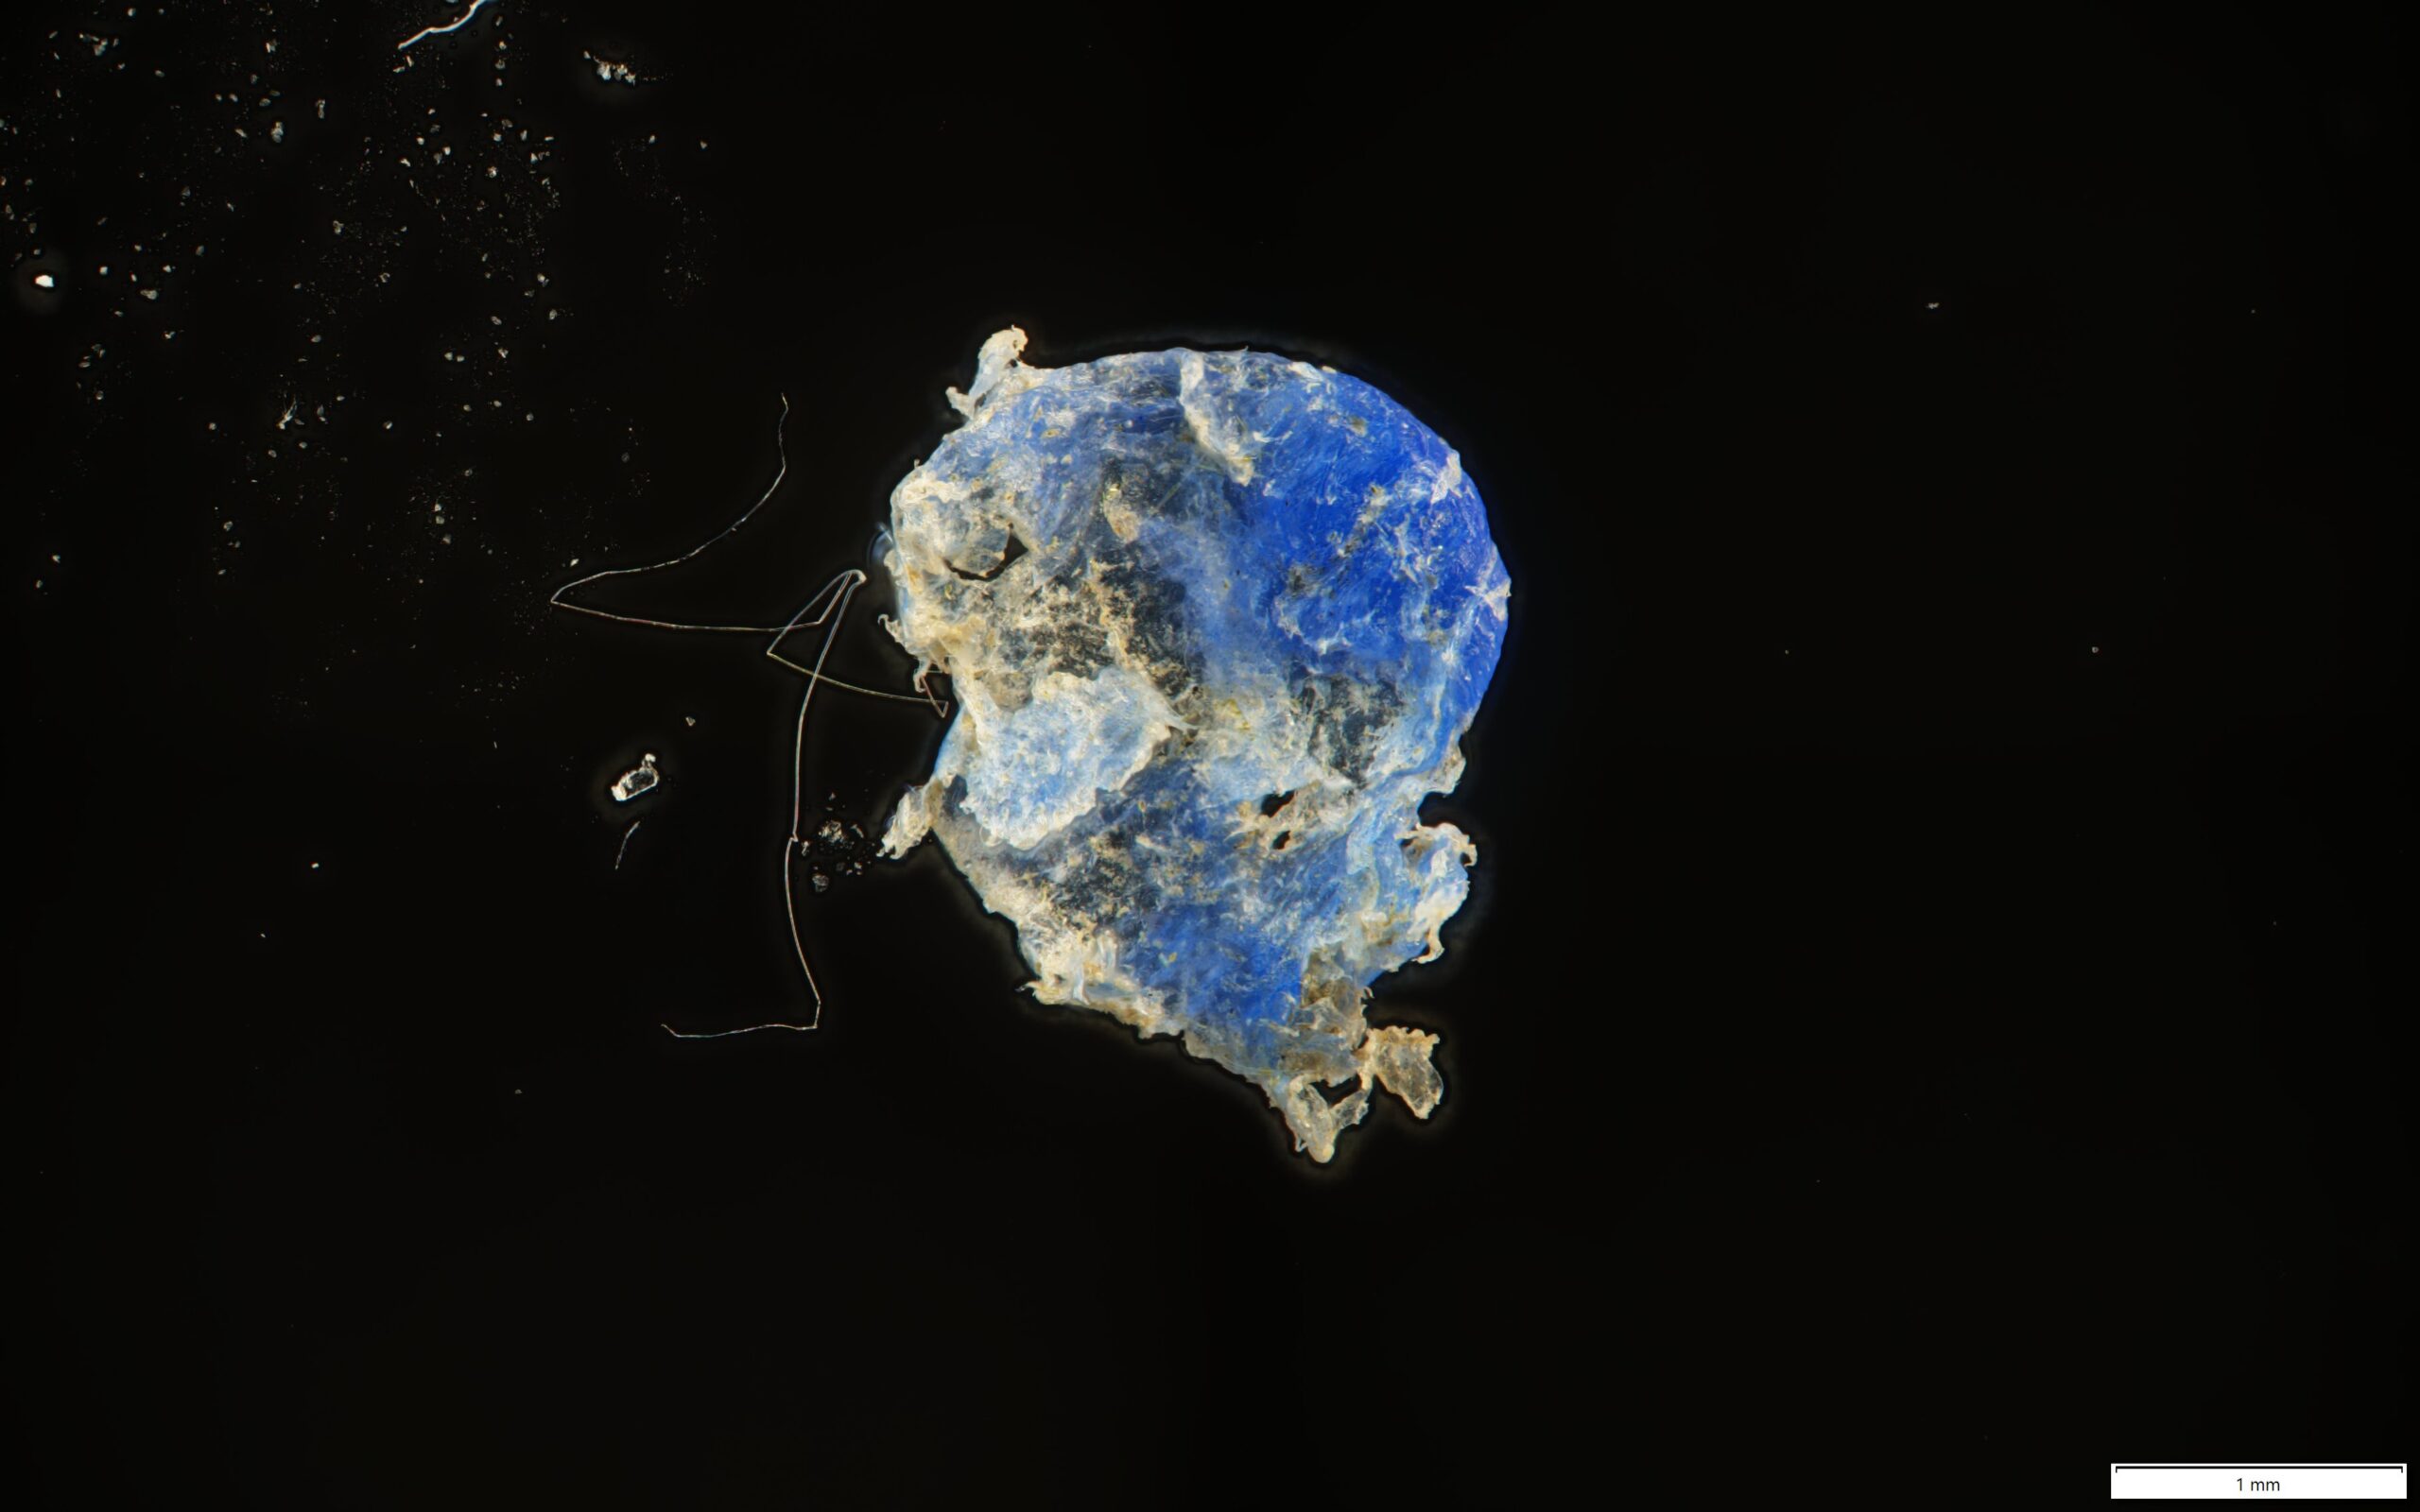
A 1mm fragment of blue plastic collected by the manta trawl, seen here under a microscope.
Tracking Microplastics Where They’ve Never Been Tracked Before
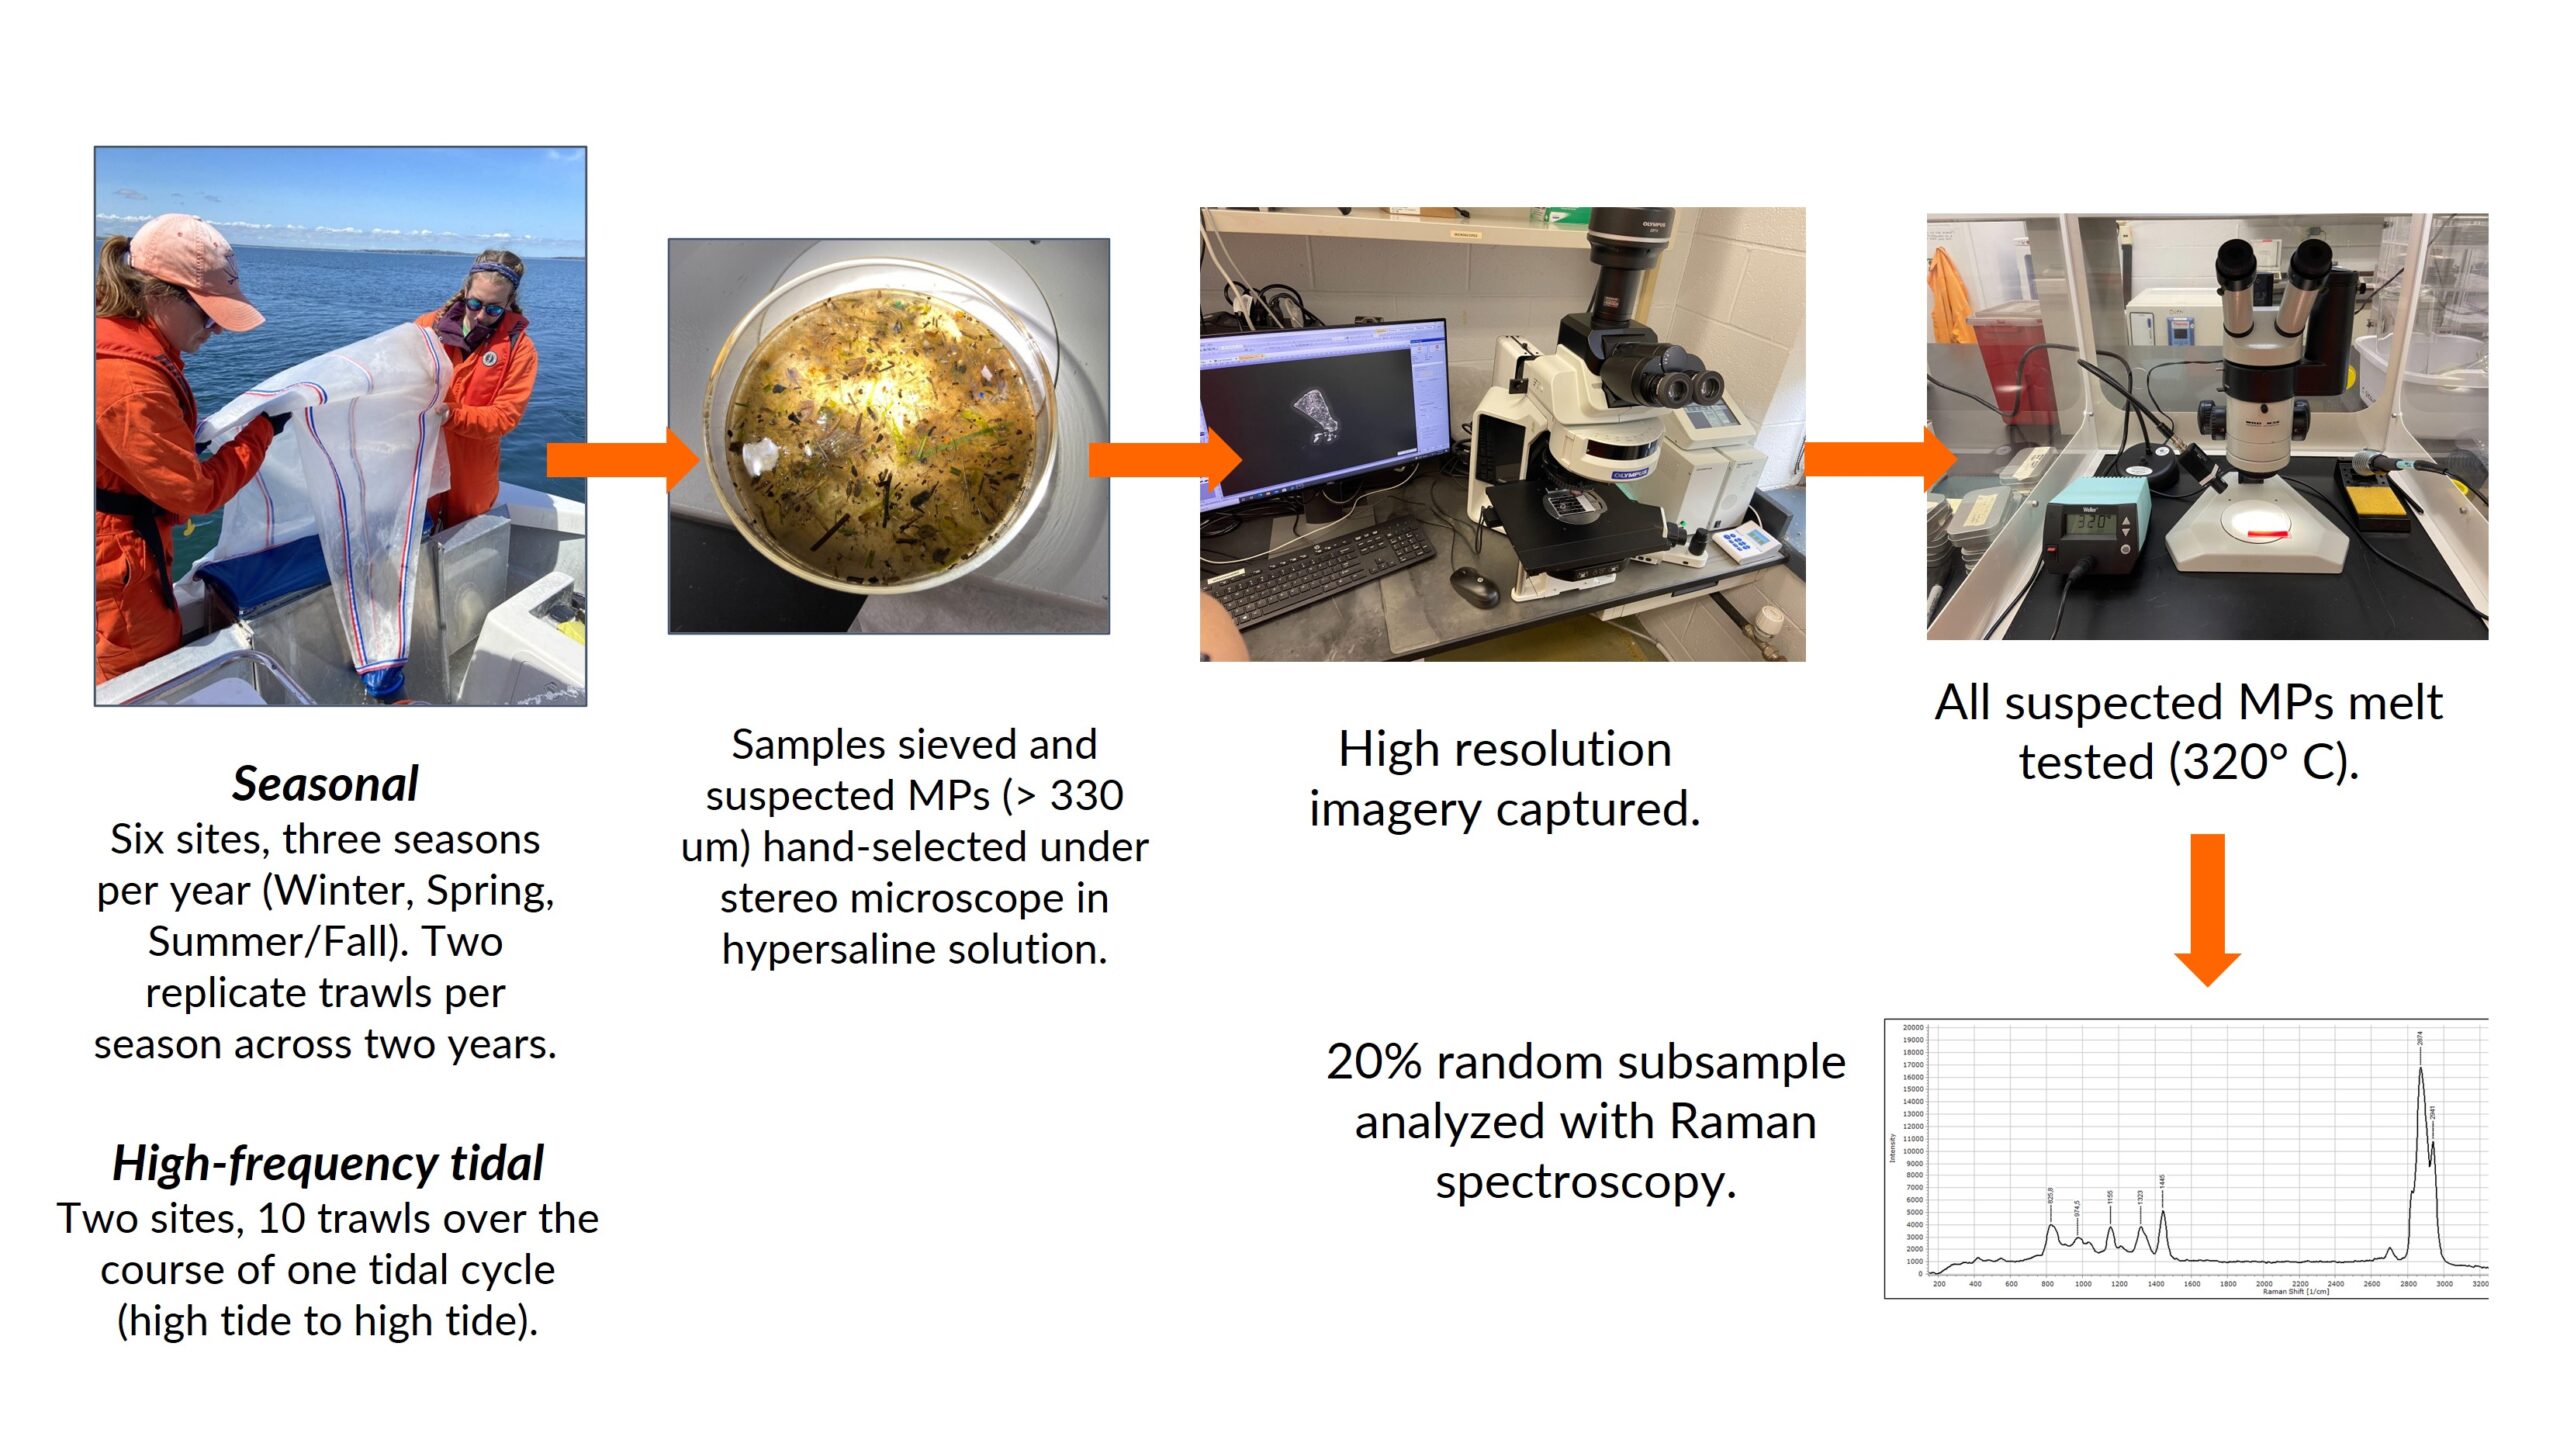
Earlier research in Narragansett Bay focused on sediments. This new work zeroed in on surface waters to see how microplastic concentrations change with tides, seasons, and storms. Davis and her team sampled six sites stretching from the heavily urbanized waters near Providence to the more rural southern bay.
Using a manta trawl to skim the surface for plastics as small as a grain of sand, they collected 92 samples over two years—across spring, summer/fall, and winter—plus high-frequency sampling to capture tidal shifts. This level of replication is rare; most microplastics studies are limited by time, funding, and the painstaking work of sorting and analyzing tiny particles.
What’s novel about this is it’s actual data on microplastic distributions at various places in the bay and under different seasonal conditions … That is gold.
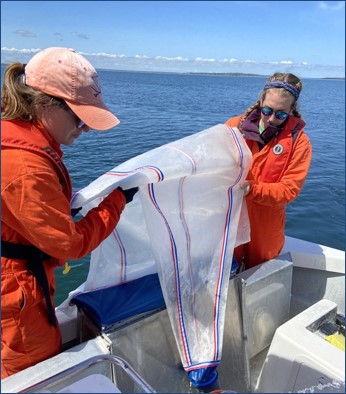
Sarah Davis uses a manta trawl with a 300 µm mesh to collect plastic samples as small as a grain of sand from one of the sites in Narragansett Bay.
“It’s important because a lot of microplastic studies have shown, including ours, that even if you sample at relatively the same location at relatively the same time, you can get really different results,” says Davis. “Microplastics aren’t homogeneously distributed. They’re discrete pieces, and can be scattered randomly.”
This kind of work also requires tough decisions about what sizes to target.
“It’s a limitation you have to define up front—what’s your size range of interest? That shapes everything: the methods you use, the volume of water you can sample,” explains Davis. As microplastics get smaller, she says, they become exponentially more abundant. “If we were looking for the tiniest particles, we’d have to cut our sample size way down because there’d be so much more to detect. The labor would be undoable. That’s part of the challenge with microplastics field research. It’s so labor-intensive.”
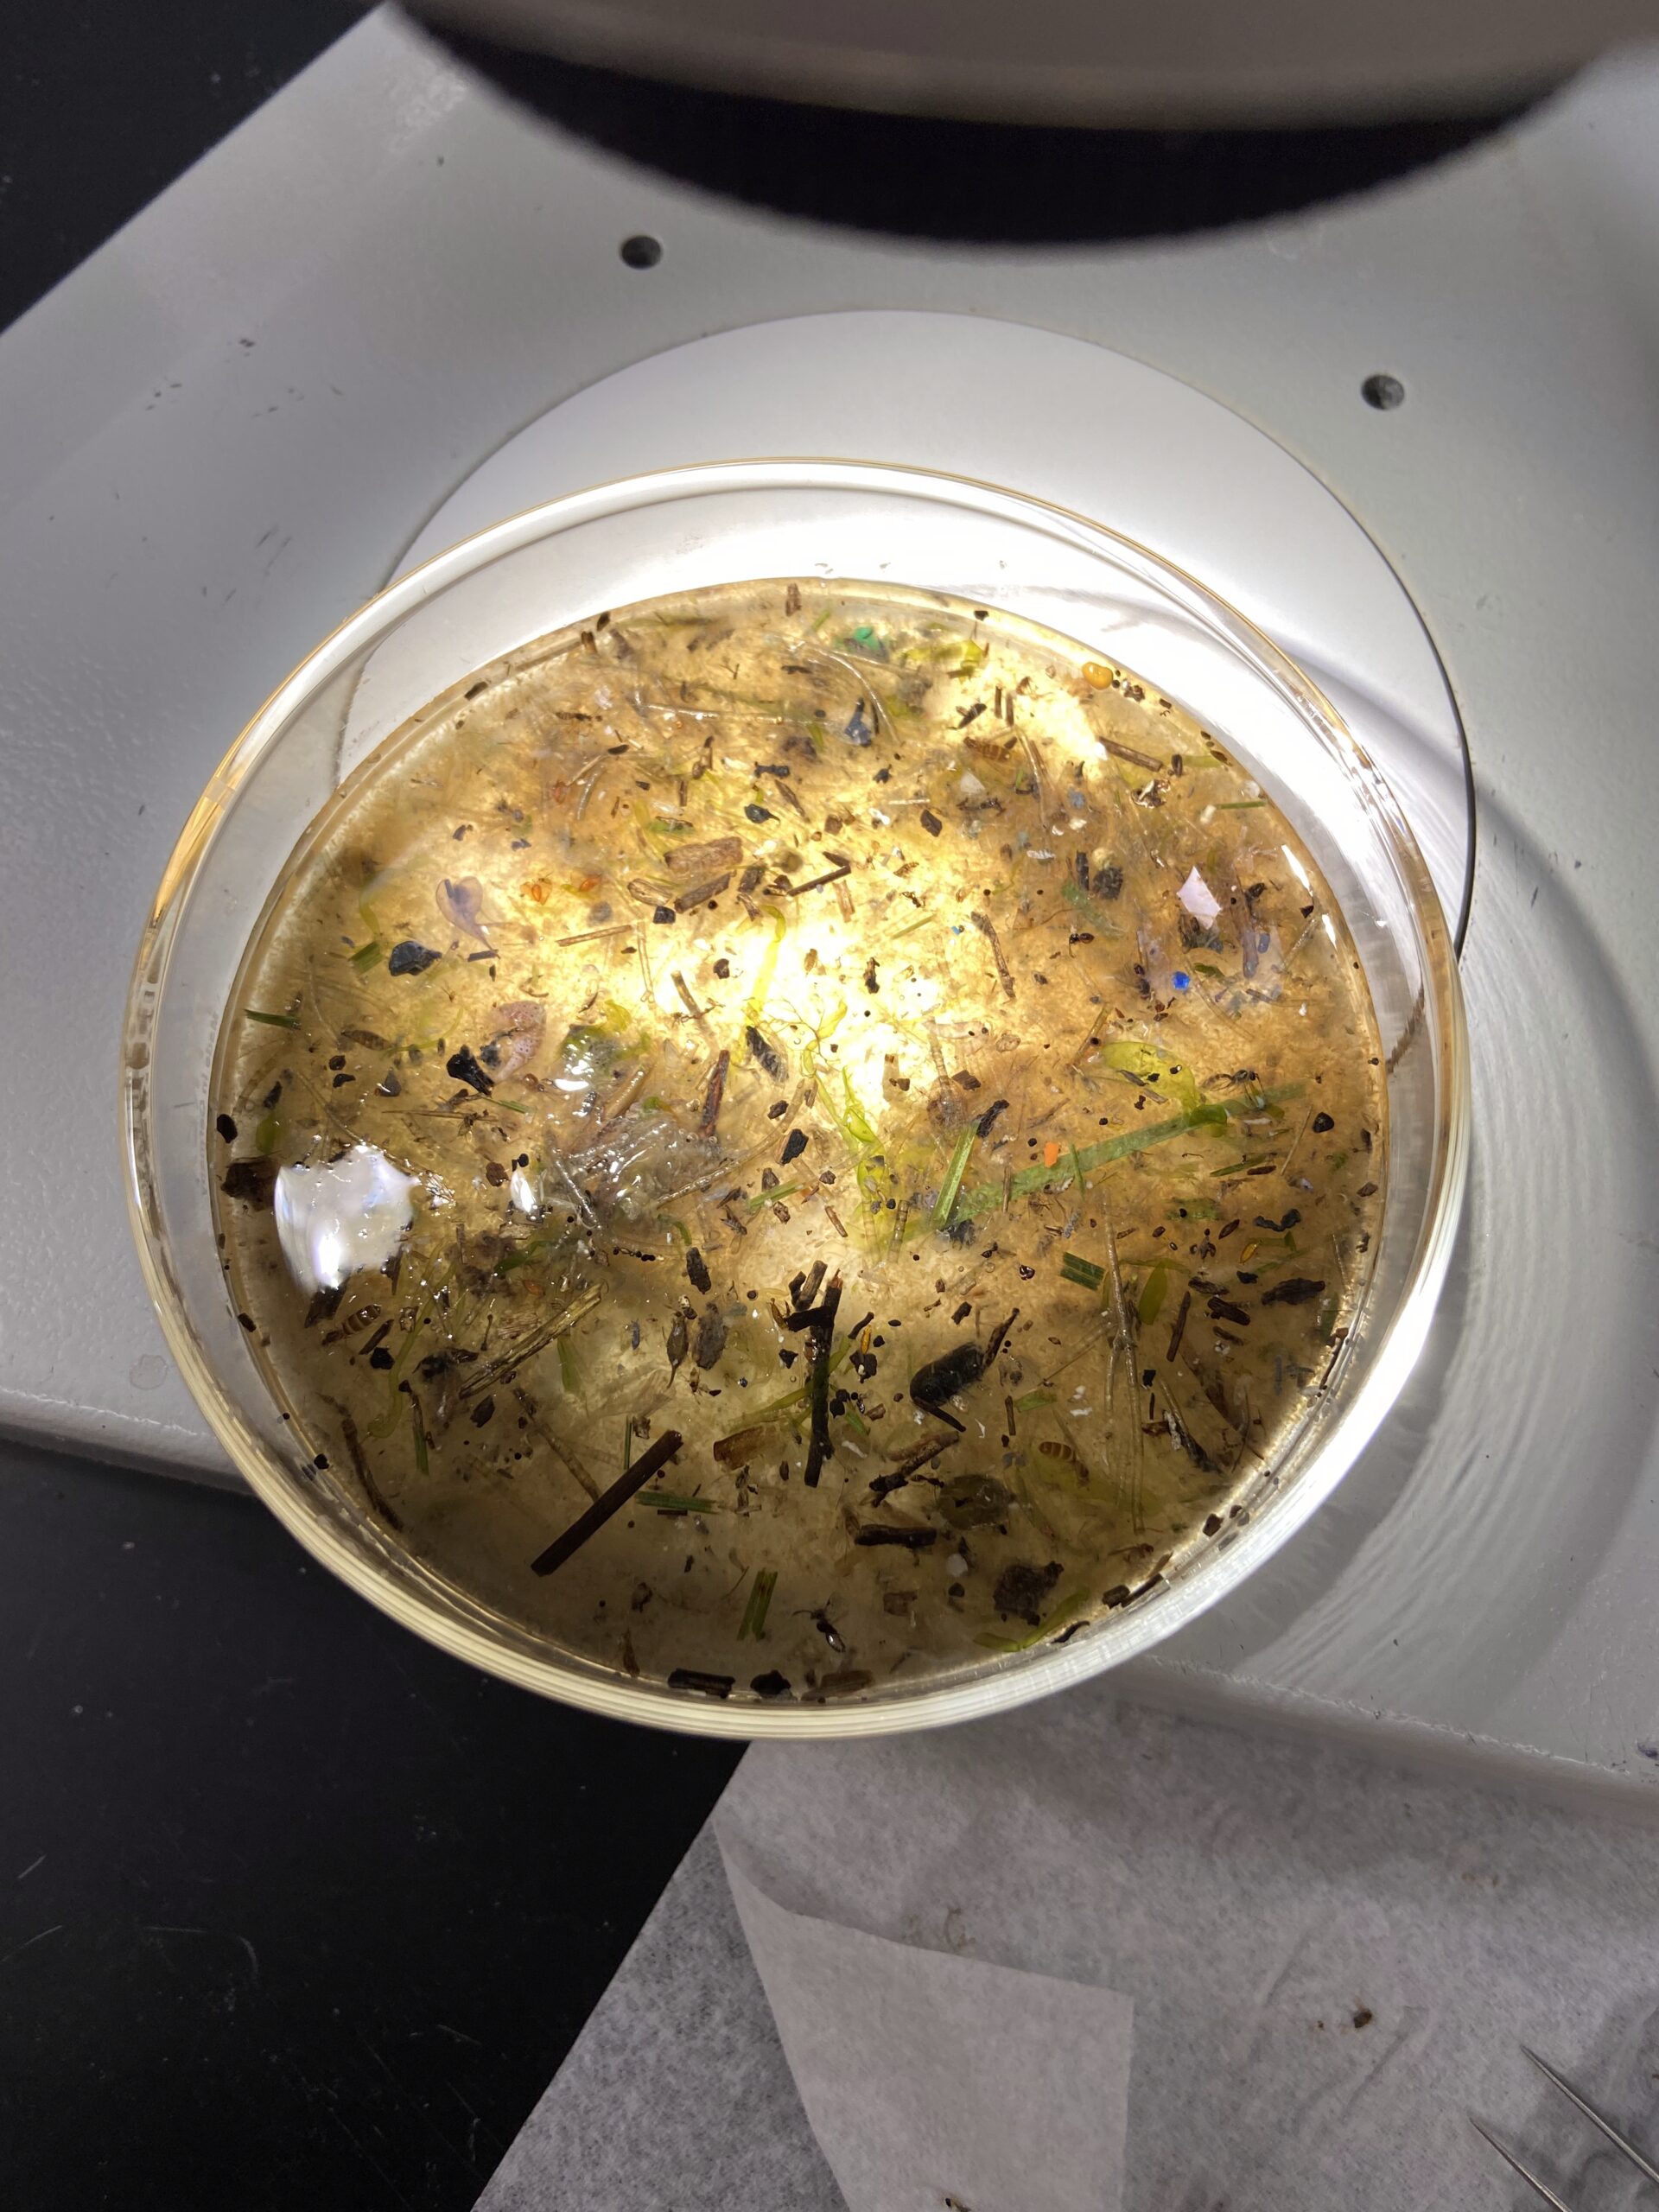
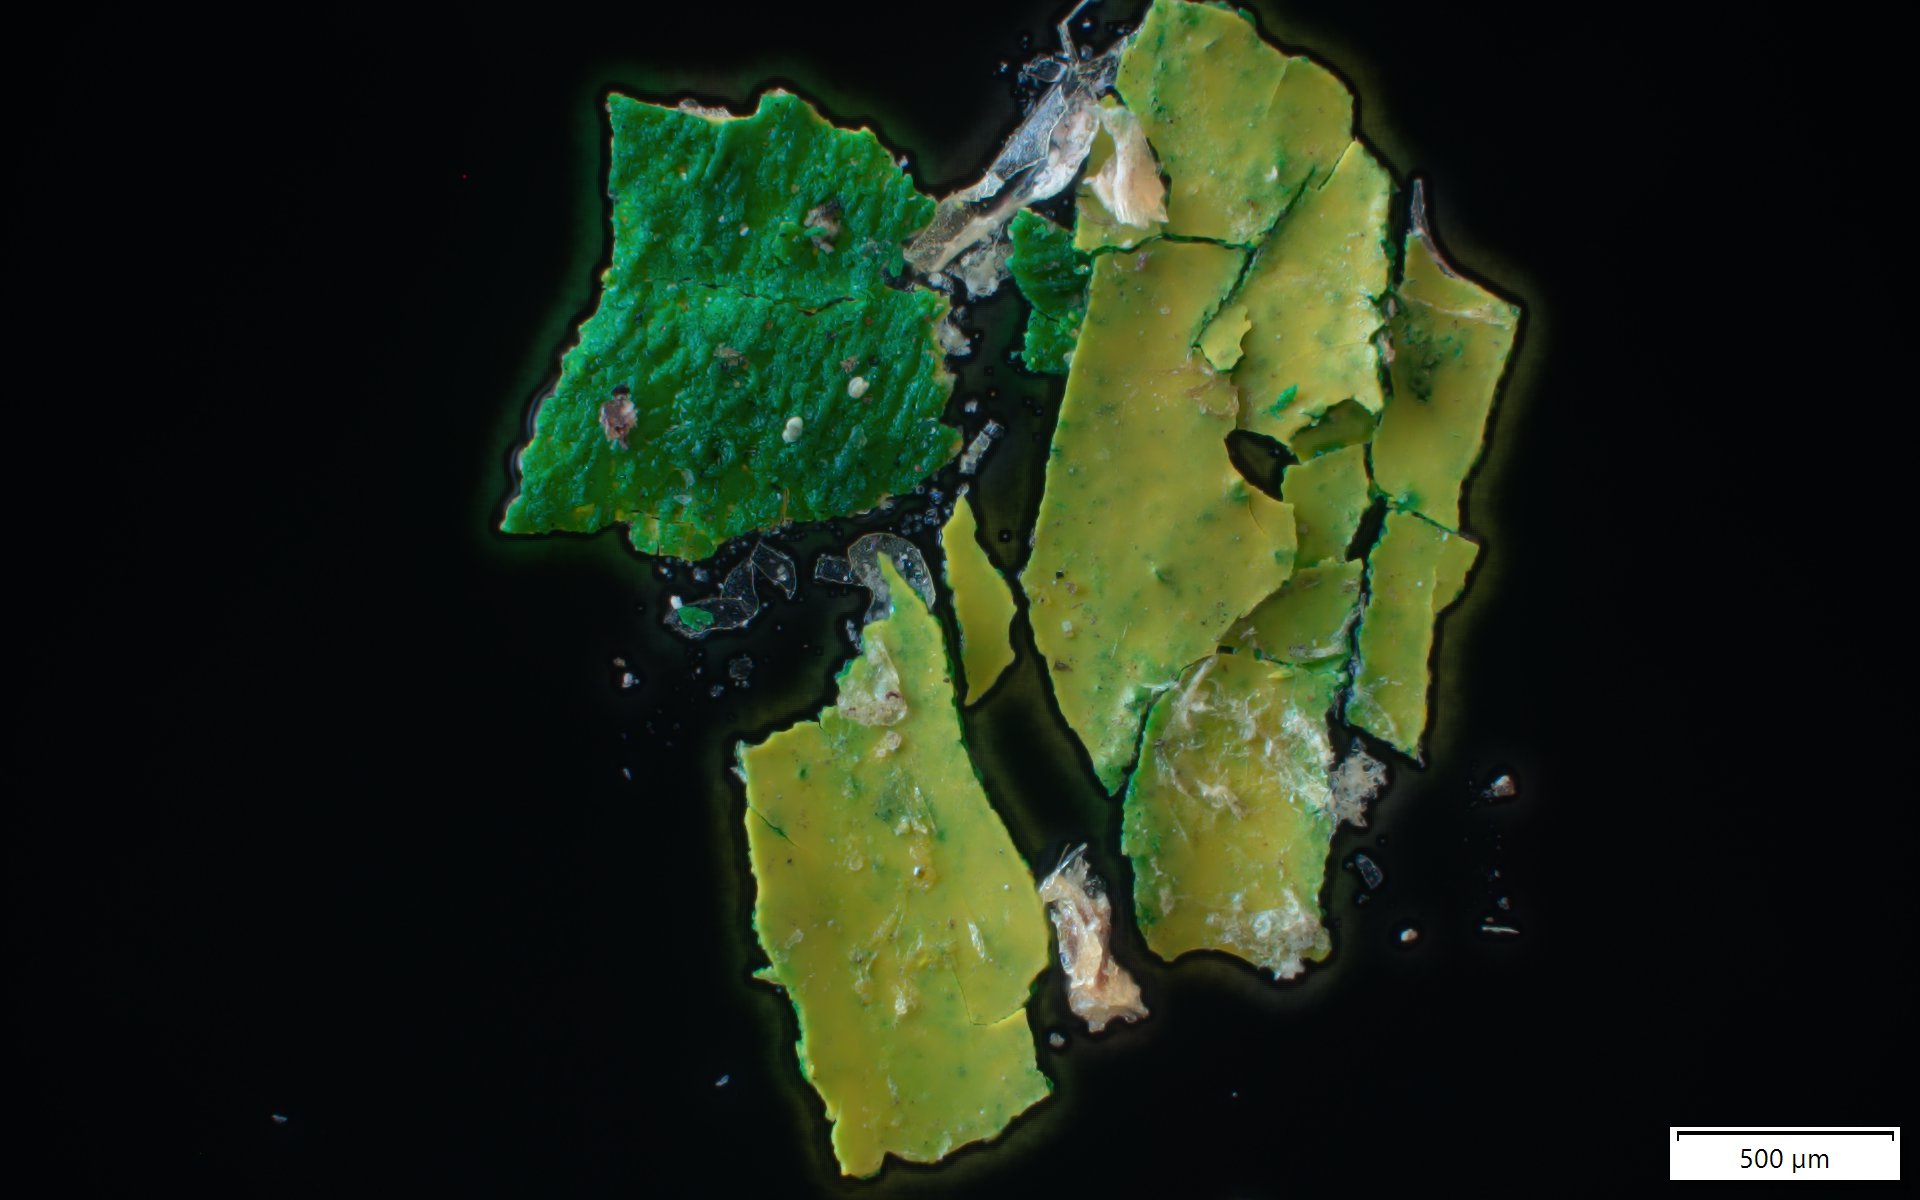
Hundreds of tiny plastic fragments collected from Narragansett Bay illustrate just how widespread microplastic pollution is. Shown here: a petri dish of samples under the microscope, and a close-up microscopic image of green plastic pieces. Photos courtesy of Sarah Davis.
Drivers of Microplastic Hotspots
As expected, concentrations were highest in the northern bay, where rivers like the Blackstone, Pawtuxet, and Taunton carry runoff from urban areas. Together, these rivers supply about 80% of the bay’s annual freshwater input, along with the pollutants that come with it.
But the study also revealed more nuanced seasonal patterns. During wetter months, increased river flows and stormwater runoff carried more microplastics into the bay, which tended to accumulate in the northern areas during summer and fall, when prevailing southerly winds kept them there. In winter, however, shifting northerly winds helped transport these plastics farther south, with the highest concentrations observed in the Western Passage.
“We’re seeing the highest recoveries of microplastics after periods of high river flow,” says Davis, pointing to unusually heavy rains in the summer and fall that boosted runoff during the first year of sampling. “We’re seeing a relationship between increased river flow and elevated concentrations of plastics, and where those plastics go is closely related to wind.”
Combining Field Data and Ocean Models
To track the movement of microplastics, the team combined new field data with computer simulations using the Regional Ocean Modeling System (ROMS). This tool, developed and supported in part by Rhode Island Sea Grant and URI scientists, including Christopher Kincaid, a co-author of the study, has long been used to study larval transport, erosion, and water quality.
For this project, they utilized a local version called the Ocean State Ocean Model (OSOM), which simulates plastic movement in Narragansett Bay using data on bay depths, river flows, wind, and water temperatures.
Kincaid notes that while the model is helpful, it’s not very detailed. Smaller circulation features, which can determine whether plastics get flushed out or trapped, are often smoothed over. That means predictions about exactly where plastics end up are less precise.
Still, pairing this best-available model with extensive new microplastic data is a big step forward, he says.
“What’s novel about this is it’s actual data on microplastic distributions at various places in the Bay and under different seasonal conditions,” Kincaid says. “That is gold. That number will still be valuable ten years from now. They’re applying it to the best available models to understand patterns, even if the models have their limitations.”
By combining fresh observational data with existing hydrodynamic tools, this study not only advances our understanding of microplastics in Narragansett Bay, it sets the stage for improving future models and management decisions.
LOCAL INVESTMENT, LASTING IMPACT
Funding from Rhode Island Sea Grant helped launch this work, sparking new donations that equipped URI with cutting-edge technology like the LDIR (Laser Directed Infrared Spectrometer), a powerful tool for identifying plastics in environmental samples. (This instrument was made possible by the generous support of Ava Wilson, URI Class ’24)
“Rhode Island Sea Grant funding for this project and other studies was key to getting the information out and getting people interested,” says Coleen Suckling, associate professor at URI.
Momentum has continued to build. Just this month, URI announced a new $7 million National Science Foundation EPSCoR grant to boost statewide capacity for studying and addressing plastic pollution, while also training the next generation of scientists.
It’s a testament to how Sea Grant investments in projects like these can catalyze even greater regional efforts to protect our waters and communities.
Why This Matters for Narragansett Bay and Beyond
Narragansett Bay is far more than a pretty backdrop. It’s a keystone for Rhode Island’s economy and culture, supporting local fisheries, recreation, tourism, and wildlife. Understanding how microplastics move through the bay can help shape where we target cleanups and how we design green infrastructure to reduce plastic runoff.
For example, the study highlights that with more than 1,500 stormwater outfalls across Rhode Island, many of which drain directly into rivers that feed the bay, investing in rain gardens, permeable pavements, and vegetated swales could significantly reduce the flow of plastics.
By being the first to map microplastic concentrations in the surface waters of Narragansett Bay and linking these patterns to seasonal drivers and human activities, this research lays the groundwork for more adaptive, effective pollution management. It also highlights the importance of year-round monitoring, as concentrations shift dramatically in response to changes in river flows, storms, and winds.
Ultimately, what’s happening in Narragansett Bay echoes the challenges faced by estuaries worldwide. As this study demonstrates, combining meticulous local fieldwork with advanced modeling can yield profound insights into how to sustain these critical ecosystems and the communities that depend on them, ensuring their health for generations to come.
Read the Full Study
“Comparing field-based microplastic observations with ocean circulation model outputs in estuarine surface waters along a human population gradient” published in Marine Pollution Bulletin.
–Meredith Haas, RISG Research Communications and Digital Media Lead
